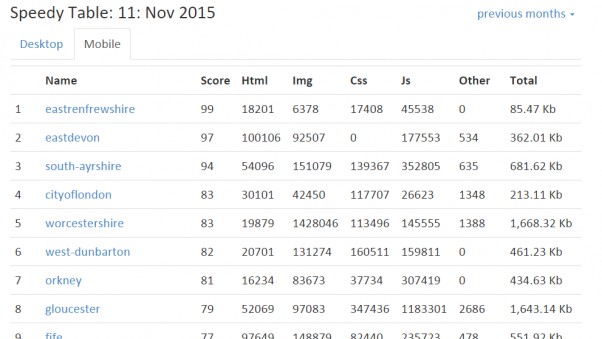
As you may, or may not, know, PageSpeedy has been running for almost two years now, checking the Google PageSpeed Insights for every local gov website once a month. This helps us to produce our rather nice (but never to be used in anger) speed table.
But just what does a speed index score actually mean? Well, Google have a nice page detailing how they arrive at the score, but to give a more “real world” example of what the scores can mean, we’ve done a bit more in depth analysis of a few sites.
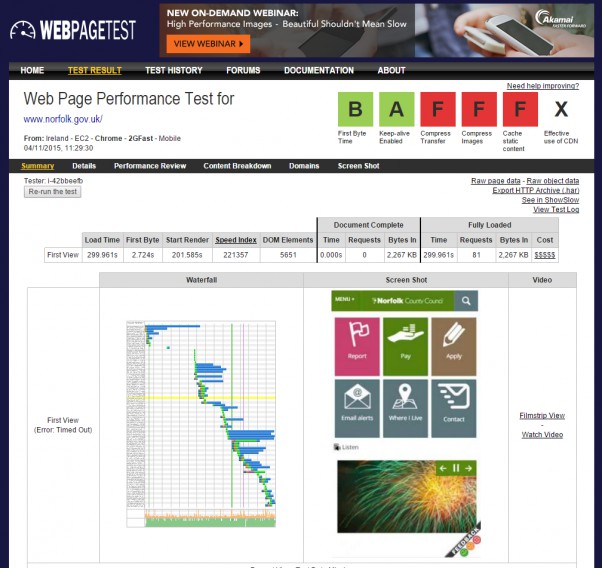
While Google PageSpeed Insights offers a headline score to give you a quick idea of your site’s speed and things you can do to make it faster, WebPageTest performs a more complete audit of your site. The data you get back from these tests give you a lot more information on how your site is performing and lets you see where to focus your efforts.
One thing that the WebPageTest does, is to offer visual representations of your site loading on different devices over different connection speeds. To illustrate the difference between sites with a high PageSpeed score and those at the lower end, we have run a number of sites through WebPageTest.
High scoring sites and load times
The top three sites on PageSpeedy in November 2013 all had good page speed insight scores - they came in at 99, 97 and 94. The problem is, that doesn’t mean very much. Below, is the table outlining how long it took a page to load on those three sites, on a “good” 3G connection.
| PageSpeed Insight | Time to render page | |
|---|---|---|
| Site A | 99 | 1.5sec |
| Site B | 97 | 2.8sec |
| Site C | 94 | 1.5sec |
The first thing you might notice, is that the page score isn’t everything. The speed of sites varies, because Google PageSpeed is analysing the site to estimate how it will load. WebPageTest is actually loading pages, and measuring the real results - either could be more accurate, since Google is vulnerable to flawed assumptions, whereas WebPageTest could fall victim to the random real-time events that make the internet suddenly and inexplicably slow.
However, the summary of this graph is that, on a “good” 3G connection, the best site takes 1.5 seconds to show the user the site. For context, it’s useful to know that the Google homepage takes around 2.2 seconds to load over the same connection.
Mid range sites in the Speedy tables
Picking some of the sites around the middle of the PageSpeedy site, we have looked at three sites who all get a 50 as their PageSpeed index score.
| PageSpeed Insight | Time to render | |
|---|---|---|
| Site N | 50 | 5.5 sec |
| Site M | 50 | 6.5 sec |
| Site L | 50 | 6.8 sec |
So, around the middle of the table, pages are loading in around 6 seconds. That’s not great, for the user experience, but it gets much worse.
Low scoring sites
This is where users really suffer. The bottom sites on the Speedy table load SOOOO SLOOOOOWLY.
| Pagespeed Insight | Time to render | |
|---|---|---|
| Site X | 17 sec | 16.7 sec |
| Site Y | 17 sec | 13.2 sec |
| Site Z | 18 sec | 16 sec |
At around 16 seconds to load the site, these sites are over 11 times slower than the fast sites. That means people have to wait an extra 15.2 seconds. Every. Time. The. Page. Loads. Which means if a user visits 4 pages they will have spent a whole minute longer, waiting. Just waiting.
All of the results above are from tests simulating a ‘Good’ 3G connection. If, like me, you’ve been stuck behind a hill or on the motorway, you will know a good 3G connection isn’t always what you get.
If you are in a mobile black spot with, say, only a 2G connection, the difference between fast and slow sites is more marked.
- Fast site : 4.1 seconds
- Slow site : 201.6 seconds (yes, that is 3 minutes and 20 seconds!)
That’s on a “good” 2G connection. When I tried to load the slowest sites on a “bad” 2G connection, it timed out. I couldn’t get it to load at all.
Faster sites, fewer calls?
Sadly, there is little in the way of hard evidence to say what effect slow websites have on people visiting local government websites.
Amazon have publicly said that a 100ms slow down can cost them 1% of sales, and Google have said 1/2 a second is a 20% drop in traffic, but those examples are from a commercial world, where you have easy alternatives. Where your audience is captive, they are less likely to leave but a lot more likely to be grumpy with you when they do get there.
One thing is for sure - I am much more likely to phone for information if a website hasn’t loaded in 3 minutes than I am to wait any longer, and as we know, phone calls are the most expensive form of customer contact our impoverished organisations do. Making the website load faster can only be a good thing.
Making it faster isn’t that hard
The reality is it really doesn’t take much to fix a slow site. Often, you don’t even have to change the design, or the layout of the page.
Looking at the slow sites, most of their issues stem from using multiple style sheets and javascript files. They not only increase load time, but also the number of requests that a browser has to make when getting the information to display a site. Merging, reducing and “minifying” these files can make a site faster without changing anything about the way it looks.
A note on adverts: Over the last few months there has been an increase in local gov sites sporting adverts. I am not a fan anyway(we’ll save that for another blog post!), but I will note the effect on page load times. A quick look at sites with adverts on shows around a 2-3 second delay on 3G page load and 6 second delay on a slower 2G connection. Most of this is likely to be related to how the adverts are implemented - they should be loaded alongside a site, and not block the user from actually doing things.

